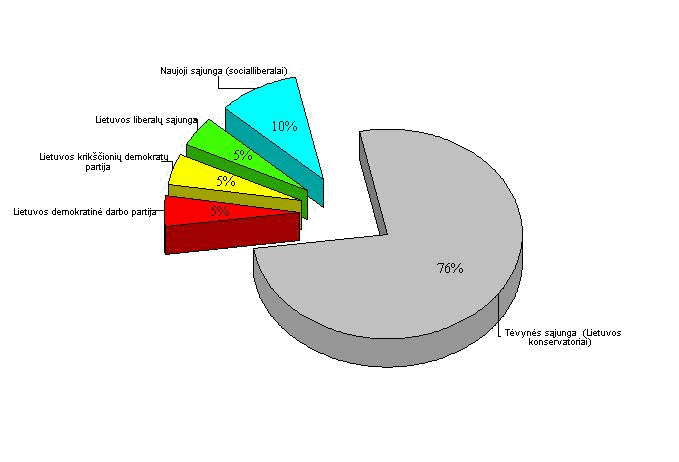
Neringa Town Electoral Area (No. 28)
Voting Results in Area
Total number of voters: 1964, turnout: 1533 (78.05%)
Invalid ballot-papers: 44 (2.87%), valid ballot-papers: 1489 (97.13%)
Number of votes cast for every list:
(click the list to see preferential votes submitted for each its candidate in electoral area)
| List No. | Party, political organisation or coalition | Number of cast votes | Mandates obtained | ||
| in electoral districts | by post | total | |||
| 22. | Homeland Union - Lithuanian Conservatives (Tevynes sajunga (Lietuvos konservatoriai)) |
1023 | 59 | 1082 | 16 |
| 7. | The New Union (Social Liberals) (Naujoji sajunga (socialliberalai)) |
121 | 4 | 125 | 2 |
| 23. | Lithuanian Democratic Labour Party (Lietuvos demokratine darbo partija) |
84 | - | 84 | 1 |
| 24. | Lithuanian Christian Democratic Party (Lietuvos krikscioniu demokratu partija) |
72 | 4 | 76 | 1 |
| 17. | Lithuanian Liberal Union (Lietuvos liberalu sajunga) |
62 | 3 | 65 | 1 |
| 25. | Lithuanian Centre Union (Lietuvos centro sajunga) |
35 | 1 | 36 | - |
| 11. | The Homeland People's Party (Tevynes liaudies partija) |
21 | - | 21 | - |
| Total: | 1418 | 71 | 1489 | 21 | |
Mandates distribution